In this section, we'll show you how to use FusionCharts and ASP to plot charts from data contained in a database. We'll create a pie chart to show "Production by Factory" using:
- dataXML method first.
- Thereafter, we'll convert this chart to use dataURL method.
- Next, we will create a multi-series line chart from database.
For the sake of ease, we'll use an Access Database. The database is present in Download Package > Code > ASP > DB folder. You can, however, use any database with FusionCharts including MS SQL, Oracle, mySQL etc.
Before you go further with this page, we recommend you to please see the previous section "Basic Examples" as we start off from concepts explained in that page.
The code examples contained in this page are present in Download Package > Code > ASP > DBExample folder. The Access database is present in Download Package > Code > ASP > DB.
Database Structure
Before we code the ASP pages to retrieve data, let's quickly have a look at the database structure.
The database contains just 2 tables:
- Factory_Master: To store the name and id of each factory
- Factory_Output: To store the number of units produced by each factory for a given date.
For demonstration, we've fed some dummy data in the database. Let's now shift our attention to the ASP page that will interact with the database, fetch data and then render a chart.
The ASP page for dataXML method example is named as BasicDBExample.asp (in DBExample folder). It contains the following code:
 <%@ Language=VBScript %>
    <HTML>
       <HEAD>
         <TITLE>FusionCharts - Database Example</TITLE>
         <SCRIPT LANGUAGE="Javascript" SRC="../../FusionCharts/FusionCharts.js"></SCRIPT>
       </HEAD>
       <!-- #INCLUDE FILE="../Includes/FusionCharts.asp" -->
       <!-- #INCLUDE FILE="../Includes/DBConn.asp" -->
       <BODY>
        <CENTER>
         <%
         'In this example, we show how to connect FusionCharts to a database.
         'For the sake of ease, we've used an Access database which is present in
         '../DB/FactoryDB.mdb. It just contains two tables, which are linked to each other.
         'Database Objects - Initialization
         Dim oRs, oRs2, strQuery
         'strXML will be used to store the entire XML document generated
         Dim strXML
         'Create the recordset to retrieve data
         Set oRs = Server.CreateObject("ADODB.Recordset")
         'Generate the chart element
         strXML = "<chart caption='Factory Output report' subCaption='By Quantity' pieSliceDepth='30' showBorder='1'
                    formatNumberScale='0' numberSuffix=' Units'>"
         'Iterate through each factory
         strQuery = "select * from Factory_Master"
         Set oRs = oConn.Execute(strQuery)
         While Not oRs.Eof
         'Now create second recordset to get details for this factory
          Set oRs2 = Server.CreateObject("ADODB.Recordset")
          strQuery = "select sum(Quantity) as TotOutput from Factory_Output where FactoryId=" & ors("FactoryId")
          Set oRs2 = oConn.Execute(strQuery)
         'Generate <set label='..' value='..'/>
          strXML = strXML & "<set label='" & ors("FactoryName") & "' value='" & ors2("TotOutput") & "' />"
         'Close recordset
          Set oRs2 = Nothing
          Rs.MoveNext
          Wend
         'Finally, close <chart> element
          strXML = strXML & "</chart>"
          Set oRs = nothing
         'Create the chart - Pie 3D Chart with data from strXML
         Call renderChart("../../FusionCharts/Pie3D.swf", "", strXML, "FactorySum", 600, 300, false, false)
        %>
       </BODY>
    </HTML>
The following actions are taking place in this code:
- We first include FusionCharts.js JavaScript class and FusionCharts.asp , to enable easy embedding of FusionCharts.
- We then include DBConn.asp, which contains connection parameters to connect to Access database.
- Thereafter, we generate the XML data document by iterating through the recordset and store it in strXML variable.
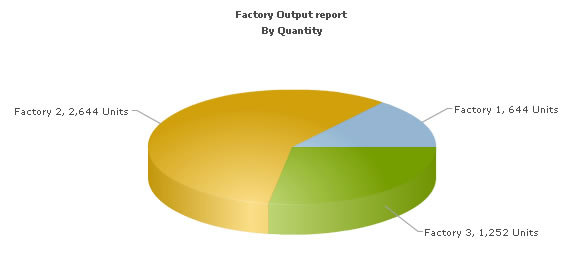
- Finally, we render the chart using renderChart() method and pass strXML as dataXML.
When you now run the code, you'll get an output as under:
Converting the example to use dataURL method
Let's now convert this example to use dataURL method. As previously explained, in dataURL mode, you need two pages:
- Chart Container Page - The page which embeds the HTML code to render the chart. This page also tells the chart where to load the data from. We'll name this page as Default.asp.
- Data Provider Page - This page provides the XML data to the chart. We'll name this page as PieData.asp
The pages in this example are contained in Download Package > Code > ASP > DB_dataURL folder.
Chart Container Page - Default.asp
Default.asp contains the following code to render the chart:
 <%@ Language=VBScript %>
   <HTML>
     <HEAD>
       <TITLE>FusionCharts - dataURL and Database  Example</TITLE>
       <SCRIPT LANGUAGE="Javascript" SRC="../../FusionCharts/FusionCharts.js"></SCRIPT>
     </HEAD>
     <!-- #INCLUDE FILE="../Includes/FusionCharts.asp" -->
     <BODY>
     <%
     'In this example, we show how to connect FusionCharts to a database
     'using dataURL method. In our previous example, we've used dataXML method
     'where the XML is generated in the same page as chart. Here, the XML data
     'for the chart would be generated in PieData.asp.
     'To illustrate how to pass additional data as querystring to dataURL,
     'we've added an animate	property, which will be passed to PieData.asp.
     'PieData.asp would handle this animate property and then generate the
     'XML accordingly.
     'For the sake of ease, we've used an Access database which is present in
     '../DB/FactoryDB.mdb. It just contains two tables, which are linked to each
     'other.
     'Variable to contain dataURL
     Dim strDataURL
     'Set DataURL with animation property to 1
     'NOTE: It's necessary to encode the dataURL if you've added parameters to it
     strDataURL = encodeDataURL("PieData.asp?animate=1")
     'Create the chart - Pie 3D Chart with dataURL as strDataURL
     Call renderChart("../../FusionCharts/Pie3D.swf", strDataURL, "", "FactorySum", 600, 300, false, false)
    %>
   </BODY>
  </HTML>
In the above code, we're:
- Including FusionCharts.js JavaScript class and FusionCharts.asp
- Create the dataURL string and store it in strDataURL variable. We append a dummy propery animate to show how to pass parameters to dataURL. After building the dataURL, we encode it using encodeDataURL function defined in FusionCharts.asp.
- Finally, we render the chart using renderChart() method and set dataURL as strDataURL.
Creating the data provider page PieData.asp
PieData.asp contains the following code to output XML Data:
<%@ Language=VBScript %>
   <!-- #INCLUDE FILE="../Includes/DBConn.asp" -->
      <%
          'This page generates the XML data for the Pie Chart contained in
   'Default.asp.
   'For the sake of ease, we've used an Access database which is present in
   '../DB/FactoryDB.mdb. It just contains two tables, which are linked to each
   'other.
   'Database Objects - Initialization
           Dim oRs, oRs2, strQuery
           'strXML will be used to store the entire XML document generated
           Dim strXML
           'Default.asp has passed us a property animate. We request that.
           Dim animateChart
           animateChart = Request.QueryString("animate")
           'Set default value of 1
           if animateChart="" then
              animateChart = "1"
           end if
           'Create the recordset to retrieve data
           Set oRs = Server.CreateObject("ADODB.Recordset")
         'Generate the chart element
           strXML = "<chart caption='Factory Output report' subCaption='By Quantity' pieSliceDepth='30'
                      showBorder='1' formatNumberScale='0' numberSuffix=' Units' animation=' " & animateChart & "'>"
           'Iterate through each factory
           strQuery = "select * from Factory_Master"
           Set oRs = oConn.Execute(strQuery)
           While Not oRs.Eof
              'Now create second recordset to get details for this factory
              Set oRs2 = Server.CreateObject("ADODB.Recordset")
              strQuery = "select sum(Quantity) as TotOutput from Factory_Output where FactoryId=" & ors("FactoryId")
              Set oRs2 = oConn.Execute(strQuery)
              'Generate <set label='..' value='..' />
              strXML = strXML & "<set label='" & ors("FactoryName") & "' value='" & ors2("TotOutput") & "' />"
              'Close recordset
              Set oRs2 = Nothing
              oRs.MoveNext
           Wend
           'Finally, close <chart> element
           strXML = strXML & "</chart>"
           Set oRs = nothing
           'Set Proper output content-type
           Response.ContentType = "text/xml"
           'Just write out the XML data
           'NOTE THAT THIS PAGE DOESN'T CONTAIN ANY HTML TAG, WHATSOEVER
           Response.Write(strXML)
      %>
In the above page:
- We first request the animate property which has been passed to it (from dataURL)
- We generate the data and store it in strXML variable
- Finally, we write this data to output stream without any HTML tags.
When you view this page, you'll get the same output as before.
Let's now see how we can create a multi-series chart from database. This is no different from creating the Pie chart we saw above.
All you need to do is to build proper XML from the database that you query from your database. Multi-series charts have a different data format from the format of an XML for a single-series chart like pie. Let us see how the code would look for this:
<%
    'In this example, we show how to connect FusionCharts to a database.
    'For the sake of ease, we've used an Access databases containing two
    'tables.
    Dim resultCategories, resultData, strQuery
    'strXML will be used to store the entire XML document generated
    Dim strXML, intCounter
    intCounter = 0
    'Creating ADODB object.
    Set resultCategories = Server.CreateObject("ADODB.Recordset")
    'SQL query for category labels
    strQueryCategories = "select distinct Format(Factory_Output.DatePro,'mm-dd-yyyy') as DatePro from Factory_Output "
    'Connect to the DB and Query database
    strQueryData = "select Factory_Master.FactoryName, Format(Factory_Output.DatePro,'mm-dd-yyyy') as DatePro,
                    Factory_Output.Quantity from Factory_Master Factory_Master,
                    Factory_Output Factory_Output where Factory_Output.FactoryID
                    = Factory_Master.FactoryId order by Factory_Output.FactoryID,
                    Factory_Output.DatePro"
    'Query database
    Set resultData = oConn.Execute(strQueryData)
    'strXML will be used to store the entire XML document generated
    'Generate the chart element
    strXML = "<chart legendPostion='' caption='Factory Output report' subCaption='By Quantity'
              xAxisName='Factory' yAxisName='Units' showValues='0' formatNumberScale='0' rotateValues='1' >"
    'Build category XML
    strXML = strXML &  buildCategories(resultCategories, "DatePro")
    'Build datasets XML
    strXML = strXML & buildDatasets ( resultData, "Quantity", "FactoryName")
    'Finally, close <chart> element
    strXML = strXML & "</chart>"
    'Create the chart - Pie 3D Chart with data from strXML
    Call renderChart("../../FusionCharts/MSLine.swf", "", strXML,
                     "FactorySum", 700, 400, false, false)
    'Free database resource
    Set resultCategories = Nothing
    Set resultData = Nothing

    '***********************************************************************************************
    ' * Function to build XML for categories
    ' * @param    result          Database resource
    ' * @param    labelField      Field name as String that contains value for chart category labels
    ' *
    ' * @return categories XML node
    ' ***********************************************************************************************
    Function buildCategories ( result, labelField )
        Dim sXML
        sXML = ""
        If Not result Is Nothing Then
            sXML = "<categories>"
            While Not result.Eof
                sXML = sXML & "<category label='" & result("DatePro") & "'/>"
                result.MoveNext
            Wend
            sXML = sXML & "</categories>"
        End If
        buildCategories = sXML
    End Function

    '***********************************************************************************************
    ' * Function to build XML for datesets that would contain chart data
    ' * @param    result         Database resource. The data should come ordered by a control break
    '                            field which would require to identify datasets and set its value to
    '                            dataset's series name
    ' * @param    valueField     Field name as String that contains value for chart dataplots
    ' * @param    controlBreak   Field name as String that contains value for chart dataplots
    ' *
    ' * @return                 Dataset XML node
    ' ***********************************************************************************************

    Function buildDatasets (result, valueField, controlBreak )
        Dim sXML
        sXML = ""
        If Not result Is Nothing Then
            controlBreakValue =""
            While Not result.Eof
                If ( controlBreakValue <> result(controlBreak) ) Then
                    controlBreakValue =  result(controlBreak)
                    If Trim(sXML) = "" Then
                        sXML = sXML & "" & "<dataset seriesName='" & controlBreakValue & "'>"
                    Else
                        sXML = sXML & "</dataset>" & "<dataset seriesName='" & controlBreakValue & "'>"
                    End If
                End If
                sXML = sXML & "<set value='" & result(valueField) & "'/>"
                result.MoveNext
            Wend
            sXML = sXML & "</dataset>"
        End If
        buildDatasets =  sXML
    End Function
    Set resultCategories = oConn.Execute(strQueryCategories)
%>
The following actions are taking place in this code:
- We first include FusionCharts.js JavaScript class and FusionCharts.asp and DBConn.asp
- We query database for all distinct dates to add them as categories labels of the chart. This is handled by buildCategories function
- We query database for all factory-wise and dates-wise output data to add them to chart (using buildDatasets function) data where data for each factory becomes a dataset
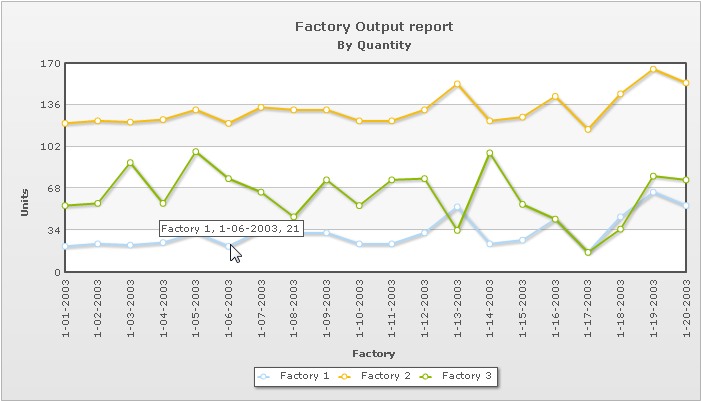
- Finally, we render the chart using renderChart() method and pass strXML as dataStr.
The chart would look as shown in the image below: